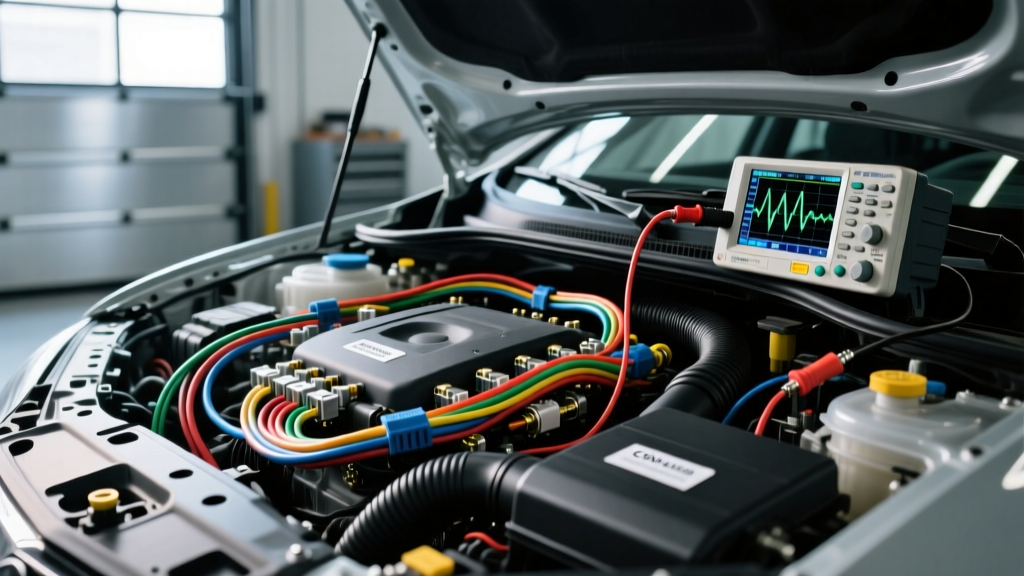
Introduction to the Ruben Auto Electric Diagnostic Protocol
Modern vehicle architecture relies heavily on multiplexed communication networks, primarily the Controller Area Network (CAN-bus), to facilitate data exchange between dozens of Electronic Control Units (ECUs). When network faults occur, traditional diagnostic approaches often lead to unnecessary module replacement and misdiagnosis. The Ruben Auto Electric methodology—a rigorous, oscilloscope-first diagnostic protocol developed through decades of master-level drivability and electrical troubleshooting—dictates that technicians must evaluate the physical layer (OSI Layer 1) non-intrusively before condemning any control module. This advanced technical deep dive explores the core tenets of this methodology, focusing on differential signaling analysis, network topology verification, and precision parasitic draw isolation.
The Fallacy of Multimeter Resistance Testing on Live Networks
A critical pillar of the Ruben Auto Electric protocol is the strict prohibition of using a Digital Multimeter (DMM) to measure termination resistance on an active CAN-bus. Standard DMMs measure resistance by injecting a small test voltage/current pulse into the circuit. When applied to a live CAN network, this injected pulse can corrupt the transceiver logic, induce phantom fault codes, or in severe cases, damage the sensitive internal electrostatic discharge (ESD) protection diodes within the ECU transceivers. Furthermore, measuring resistance with the network powered yields parallel resistance readings through the ECU's internal circuitry, rendering the 120-ohm split termination verification entirely inaccurate. True termination verification must only be performed with the vehicle battery disconnected and the network allowed to fully discharge, or by utilizing an oscilloscope to analyze the differential waveform amplitude under load.
OBD-II DLC Breakout and Network Topology
Before connecting diagnostic equipment, a master technician must understand the vehicle's specific network topology. The OBD-II Data Link Connector (DLC) serves as the primary gateway for network analysis. While Pin 6 (CAN-High) and Pin 14 (CAN-Low) are mandated by SAE J1979 for the high-speed powertrain network, modern vehicles utilize multiple CAN rings (e.g., Chassis, Infotainment, Telematics) that may be routed through a Central Gateway Module rather than directly to the DLC.
Standard OBD-II DLC Pinout Reference
| DLC Pin | Network / Signal | Typical Wire Gauge | Common Insulation Colors (GM/Ford) |
|---|---|---|---|
| Pin 6 | CAN-High (HS-CAN / Powertrain) | 20 AWG (0.5 mm²) | Dark Green / White-Blue |
| Pin 14 | CAN-Low (HS-CAN / Powertrain) | 20 AWG (0.5 mm²) | Dark Blue / White |
| Pin 3 | CAN-High (MS-CAN / Body) | 22 AWG (0.35 mm²) | Light Green / White-Green |
| Pin 11 | CAN-Low (MS-CAN / Body) | 22 AWG (0.35 mm²) | Light Blue / White-Violet |
| Pin 1 | Single Wire CAN (SW-CAN / GMLAN) | 20 AWG (0.5 mm²) | Light Green/Black |
Note: High-Speed CAN pairs must maintain a strict twisted-pair geometry with a twist rate of approximately 1 twist per inch (2.54 cm) to ensure optimal Common Mode Rejection Ratio (CMRR) and minimize electromagnetic interference (EMI) from high-current ignition or fuel injection circuits.
Oscilloscope Configuration and Differential Math Channels
The cornerstone of the Ruben Auto Electric method is the use of a high-sampling-rate automotive oscilloscope (such as a PicoScope 4425A) to capture the physical layer signaling. Connecting the scope via a non-intrusive breakout box or back-probing the ECU connectors using specialized T-pin probes preserves the integrity of the sealed Molex MX150 or TE Automotive AMPSEAL terminals.
Scope Setup Parameters for HS-CAN
- Channel A (CAN-High): Connect to DLC Pin 6. Set voltage range to ±5V. DC Coupling.
- Channel B (CAN-Low): Connect to DLC Pin 14. Set voltage range to ±5V. DC Coupling.
- Timebase: 20 µs/div to capture individual bit transitions (assuming 500 kbps, one bit = 2 µs).
- Trigger: Edge trigger on Channel A, rising edge, at approximately 2.8V.
- Math Channel: Configure a differential math channel (A - B). This subtracts the CAN-Low signal from the CAN-High signal, revealing the true differential voltage that the transceiver's differential receiver actually interprets.
During the recessive state (logic 1), both CAN-H and CAN-L rest at approximately 2.5V, resulting in a differential voltage of 0V. During the dominant state (logic 0), CAN-H rises to ~3.5V and CAN-L drops to ~1.5V, creating a differential voltage of approximately 2.0V. Any deviation in these thresholds, or asymmetry in the waveform edges, indicates physical layer degradation, such as corroded splices, failing common-mode chokes, or degraded transceiver output stages.
CAN-Bus Physical Layer Fault Matrix
When analyzing the captured waveforms, technicians must cross-reference anomalies against known physical failure modes. The following matrix is a staple in advanced electrical diagnostics, referencing guidelines established by Bosch Mobility Solutions and Pico Technology's Automotive Waveform Library.
| Fault Condition | CAN-H Voltage | CAN-L Voltage | Differential Voltage | Network Behavior |
|---|---|---|---|---|
| Normal Operation | 2.5V to 3.5V | 2.5V to 1.5V | 0V (Recessive) / 2.0V (Dominant) | Flawless ECU communication |
| CAN-H Short to Ground | 0.0V | 0.0V to 1.2V | Near 0V | Total network failure, U-codes set |
| CAN-L Short to Battery (12V) | 12.0V | 12.0V | 0V | Total network failure, transceiver protection activates |
| CAN-H and CAN-L Shorted Together | ~2.5V (Fluctuating) | ~2.5V (Fluctuating) | 0V | Total network failure, no differential signal |
| Missing Termination Resistor | Overshoot/Ringing > 4.0V | Undershoot/Ringing < 1.0V | Exceeds 2.5V peak | Intermittent dropouts at high bus loads |
Advanced Parasitic Draw: The Fuse Voltage Drop Method
A frequent symptom of CAN-bus physical layer faults is a module failing to enter its 'sleep' state, resulting in a parasitic draw that depletes the 12V battery. The Ruben Auto Electric protocol strictly forbids the traditional method of pulling fuses one by one with an ammeter in series, as breaking the circuit wakes up the network and resets the sleep timer (which can take up to 45 minutes on modern architectures like those detailed in SAE J1939 and OEM-specific gateway protocols).
Executing the mV Drop Measurement
Instead, technicians must use the Fuse Voltage Drop method. This involves measuring the millivolt (mV) drop across the blade fuses in the Power Distribution Center (PDC) while the vehicle is fully asleep and the circuit remains intact.
- Prepare the Vehicle: Close all doors, latch the hood (to simulate closed state), lock the vehicle, and wait for the CAN-bus to transition to sleep (verified by the oscilloscope showing a flat 2.5V line on both channels).
- Configure the DMM: Set a high-resolution DMM (minimum 4.5 digits) to the millivolt DC scale.
- Measure the Drop: Place the DMM probes on the exposed test points on the top of each standard Mini (ATM), ATO, or Micro2 (ATT) fuse.
- Calculate the Current: Apply Ohm's Law (I = V / R). A standard 10A Mini fuse has an internal resistance of approximately 7.5 mΩ (0.0075 Ω). If your DMM reads 1.5 mV (0.0015 V) across the 10A fuse, the parasitic draw through that specific circuit is: 0.0015V / 0.0075Ω = 0.20A (200mA).
By utilizing a pre-calculated fuse resistance chart, a technician can scan an entire PDC in under five minutes without ever interrupting the network's sleep state. If a specific module (e.g., the Telematics Control Unit or Body Control Module) is found to be drawing 400mA continuously, the technician can then isolate the specific CAN-bus branch keeping that module awake, often tracing the fault to a chafed 20 AWG twisted pair rubbing against a chassis ground point near the A-pillar hinge.
Terminal Pin Drag and Connector Integrity
Finally, waveform anomalies are frequently caused by microscopic terminal fretting corrosion or loss of terminal retention force. When back-probing fails to reveal a hard fault, the Ruben Auto Electric methodology mandates a 'pin drag' test. Using a standardized, unused dummy pin of the exact same series (e.g., a Molex MX150 male terminal), the technician inserts it into the female ECU connector cavity. There must be a distinct, measurable mechanical drag. If the dummy pin slides in with zero resistance, the female terminal tang is fatigued, causing micro-arcing and intermittent CAN-bus impedance spikes that a standard DMM will never catch, but an oscilloscope will display as high-frequency noise on the dominant bit edges.
Conclusion
Mastering automotive electrical diagnostics requires moving beyond basic continuity testing and embracing the physics of differential signaling and network topology. By adhering to the rigorous, non-intrusive, and data-driven protocols championed by elite diagnostic methodologies, technicians can accurately isolate CAN-bus faults, preserve sensitive ECU hardware, and resolve complex parasitic draws with surgical precision.