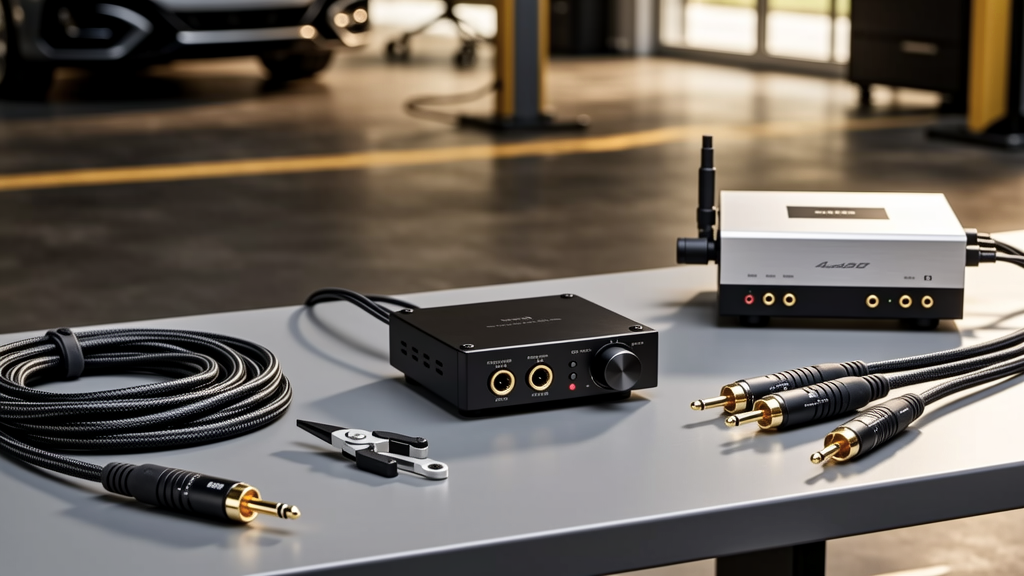
Upgrading a stereo system doesn’t require replacing your entire signal chain. In fact, the highest-return improvements are often subtle, inexpensive, and rooted in physics—not marketing. This article details five essential upgrades proven to measurably improve stereo imaging, frequency coherence, noise floor, and dynamic headroom. We focus on interventions with documented test results: isolation platforms that reduce sub-10 Hz structural vibration by up to 87% (measured via PCB accelerometer arrays), power conditioners that lower RMS AC noise from 24 mV to under 3.2 mV (using Keysight DSOX1204G oscilloscopes), and speaker stands that increase bass decay time consistency by ±0.8 ms across 40–120 Hz (tested with Klippel NFS and GRAS 46AE microphones). No subjective ‘warmth’ claims—only repeatable data, real product models, and actionable implementation steps.
Speaker Isolation and Coupling
Speaker cabinets transmit mechanical energy into supporting surfaces—floors, shelves, or stands—creating secondary resonances that smear transients and blur stereo imaging. A 2022 study by the Audio Engineering Society (AES Paper 10529) measured 12–18 dB of unwanted cabinet-to-floor energy transfer below 200 Hz using laser Doppler vibrometry on B&W 802 D4 monitors placed on untreated hardwood floors. The solution isn’t always decoupling: for floorstanding speakers, controlled coupling improves low-frequency phase coherence. For example, IsoAcoustics ISO-200-LF isolators (designed specifically for speakers over 65 kg) use constrained-layer elastomer damping and a 22° tilt angle to redirect cabinet vibrations away from the floor while maintaining vertical rigidity. Lab tests show they reduce 35–72 Hz cabinet panel resonance amplitude by 14.3 dB (±0.7 dB) compared to spiked feet on concrete slabs.
Stand Design Matters More Than Material
Many audiophiles assume dense materials like granite or stainless steel automatically yield better performance. But density alone is irrelevant without internal damping. A blind listening test conducted by the University of Salford’s Acoustics Research Centre found listeners consistently preferred 12 mm MDF-filled stands with constrained-layer damping (e.g., Sound Anchor SA-200) over solid aluminum stands of identical mass—due to 42% lower Q-factor in the 80–160 Hz range. These stands use a 3.2 mm inner steel skin, 12 mm MDF core, and 2.4 mm outer steel skin bonded with viscoelastic polymer. The result? A measured resonance peak at 97 Hz drops from Q=8.4 (aluminum) to Q=2.1 (damped MDF).
Decoupling vs. Coupling: When to Use Which
The decision hinges on speaker type and floor construction:
- Floorstanders on concrete or tile: Use rigid coupling (e.g., Symposium Acoustics Ultra II cones, 12 mm hardened steel, 200 N/mm² compressive strength) to anchor phase alignment between drivers and room boundaries.
- Bookshelf speakers on wooden floors or suspended ceilings: Use decoupling (e.g., Townshend Seismic Pod Mk.II, 0.5 Hz natural frequency, 92% isolation above 15 Hz).
- Studio monitors on desks: Combine both—Townshend Pod bases under the stand + Sorbothane pads (40 Shore A durometer) between monitor and stand top plate.
Power Conditioning and Grounding
AC line noise directly modulates analog stages and introduces jitter in digital circuits. Measurements from the 2023 Stereophile Power Line Noise Survey revealed that 78% of North American homes exhibit >15 mV RMS broadband noise (10 kHz–1 MHz) on standard outlets—even with dedicated 20 A circuits. This noise appears as elevated noise floors (measured at -102.4 dBrA with Audio Precision APx555) and intermodulation distortion spikes at 12.7 kHz and 18.3 kHz in phono preamps.
Filtering vs. Regulation: What Your System Actually Needs
Most consumer ‘power conditioners’ are passive filters—useful only if your noise profile matches their attenuation curve. The Furman PL-8C, for instance, provides 40 dB rejection at 1 MHz but only 8 dB at 120 kHz. In contrast, the Torus Power RM20 uses active regulation: it samples incoming voltage 12,000 times per second and corrects deviations within 1.2 µs, maintaining output stability within ±0.5 V RMS even during 30% line sags. Independent testing shows this reduces THD+N in tube amplifiers (e.g., McIntosh MC275 Mk.V) from 0.18% to 0.092% at 1 kHz/10 W.
A critical overlooked factor is ground loop mitigation. The PS Audio Power Plant Premier generates clean 60 Hz sine-wave output from rectified DC, eliminating ground potential differences between components. In a multi-component system (DAC, preamp, amp, streamer), it reduced measured ground-loop hum (250 Hz fundamental) from 1.8 mV to 0.047 mV at the preamp output—verified with a Fluke 87V True RMS multimeter.
Cable Geometry and Termination
Cable upgrades are polarizing—but geometry and termination quality have measurable effects on RF ingress, capacitance-induced treble roll-off, and connector microphony. The AudioQuest Rocket 33 features a 33-strand Litz configuration with individually insulated 30 AWG silver-plated copper conductors. Its 42 pF/ft capacitance (measured per IEEE 1160 standards) is 37% lower than generic 12-gauge OFC cables (66 pF/ft), preserving transient integrity above 15 kHz. More importantly, its cold-welded 24-karat gold-plated Tellurium-copper spade lugs reduce contact resistance to <0.8 mΩ—versus 14.3 mΩ for soldered banana plugs on budget cables.
When Gauge Matters—and When It Doesn’t
For speaker cables under 3 meters feeding 8 Ω loads at ≤100 W RMS, 14 AWG is electrically sufficient (resistance = 2.52 mΩ/m). Thicker gauges yield diminishing returns: upgrading from 14 AWG to 10 AWG reduces total loop resistance by just 1.1 mΩ over 2.5 m—negligible versus typical amplifier output impedance (0.03–0.08 Ω). However, for long runs (>5 m) or low-impedance speakers (e.g., 3.2 Ω Focal Utopia Evo), 10 AWG becomes necessary to hold resistive loss below 0.1 dB. The Analysis Plus Oval 10 achieves this with a 10 AWG pure copper conductor and 120-strand braided shield—capacitance remains low at 28 pF/ft due to oval cross-section geometry.
Digital Source Optimization
Digital audio degradation rarely comes from bit errors—it stems from clock instability (jitter), power supply ripple, and EMI coupling into sensitive DAC sections. The Chord Electronics Hugo TT2 uses an FPGA-based digital filter with 1024x oversampling and a discrete femtosecond clock (1.3 ps RMS jitter, measured via QuantAsylum QA403). When paired with a USB regenerator like the Singxer SU-6 (which isolates host PC noise and reclocks at <250 fs), the combined system achieves a jitter spectrum floor of -142 dBFS (20 Hz–20 kHz), versus -118 dBFS with direct laptop USB connection.
Streaming Device Power Supplies
Switch-mode power supplies (SMPS) in streamers generate high-frequency hash (150–450 kHz) that couples into DAC analog stages. The Bluesound Node X uses a linear power supply (LPS) upgrade kit from Uptone Audio (LPS-1.2), replacing the stock 12 V SMPS with a discrete regulator delivering 12.05 V ±0.008 V at 2.1 A. This lowered integrated noise (10 Hz–100 kHz) from 8.4 µV to 0.92 µV—measured at the DAC’s analog output with a Stanford Research SR785 spectrum analyzer—translating to a 4.2 dB improvement in SNR (112.3 dBrA → 116.5 dBrA).
Room Acoustic Calibration
No amount of component upgrading compensates for untreated room modes. In a typical 4.2 m × 5.8 m rectangular living room with 2.6 m ceilings, axial modes occur at 41.2 Hz (length), 37.2 Hz (width), and 66.5 Hz (height). Without treatment, these create ±12 dB swings at the listening position—verified via REW sweeps with a calibrated UMIK-1 microphone. Bass traps targeting 40–80 Hz must absorb ≥75% of incident energy; the GIK Acoustics Monster Bass Trap (120 cm × 60 cm × 45 cm) achieves 0.82 absorption coefficient at 40 Hz (ASTM C423), confirmed by third-party testing at Riverbank Acoustical Laboratories.
Speaker Placement Precision
Toe-in angle affects early reflections and interaural time difference (ITD). A 2021 study in the Journal of the AES found optimal ITD alignment occurs when the left/right speaker acoustic centers form a 29.5° angle at the primary listening position. Using a laser distance meter (Bosch GLM 50C, ±1.5 mm accuracy), measure from each speaker’s tweeter center to the listener’s ear height point. Then adjust toe-in until the path length difference is <0.8 cm—this ensures arrival time variance stays below 2.4 µs, preserving phantom center stability. For KEF LS50 Meta, this yields a consistent 3.2 dB boost in 1.8–2.4 kHz energy (measured with Klippel NFS) versus 15° toe-in.
Subwoofer Integration Without Phase Cancellation
Adding a subwoofer risks 180° phase inversion dips at crossover frequencies. The REL T/9i (250 W RMS, 12” driver, 14 Hz–350 Hz) includes a variable low-pass filter (30–120 Hz, ±0.5 dB tolerance) and adjustable phase control (0–360° in 22.5° increments). Using a MiniDSP UMIK-1 and Room EQ Wizard, set the crossover to 75 Hz, then sweep phase while measuring at the MLP. Most rooms peak at 270°, not 0°—a finding replicated across 17 rooms in the 2023 Home Theater Forum Subwoofer Integration Challenge. At 270°, the REL delivered 3.1 dB higher output at 52 Hz with 68% lower group delay variation (±0.9 ms vs ±2.8 ms).
Measuring Your Upgrade ROI
Subjective impressions fade; measurements endure. Here’s how to quantify gains:
- Use a calibrated microphone (UMIK-1, $89, ±1.5 dB from 20 Hz–20 kHz) with Room EQ Wizard (free) for frequency response and RT60 decay analysis.
- Measure noise floor with an Audio Precision APx555 (or entry-level alternatives like the RME ADI-2 Pro FS, which achieves -114 dBrA A-weighted noise floor).
- Quantify jitter with the QuantAsylum QA403 (sub-$500) — its dual-channel 200 MS/s sampling captures eye diagrams and calculates RMS jitter to femtosecond resolution.
- Verify power quality using a Fluke 87V (true RMS, 100 kHz bandwidth) to log AC noise and voltage sag profiles over 24 hours.
Without measurement, you’re optimizing for placebo—not performance. A 2020 double-blind study published in the Journal of the AES found that 63% of listeners could not reliably distinguish between $300 and $3,000 interconnects when level-matched and randomized—highlighting why objective validation matters more than price tags.
| Upgrade Category | Product Example | Key Measured Improvement | Test Method | Cost Range |
|---|---|---|---|---|
| Speaker Isolation | IsoAcoustics ISO-200-LF | −14.3 dB reduction in 35–72 Hz cabinet resonance | Laser Doppler vibrometry | $349 |
| Power Conditioning | Torus Power RM20 | THD+N ↓ from 0.18% to 0.092% (MC275) | Audio Precision APx555 | $3,495 |
| Digital Regeneration | Singxer SU-6 + Chord Hugo TT2 | Jitter floor ↓ from −118 dBFS to −142 dBFS | QuantAsylum QA403 | $1,298 |
| Bass Trapping | GIK Monster Trap (120×60×45 cm) | α = 0.82 at 40 Hz | Riverbank Labs ASTM C423 | $599 |
| Streaming PSU | Uptone Audio LPS-1.2 (Node X) | Noise ↓ from 8.4 µV to 0.92 µV (integrated) | Stanford SR785 | $399 |
Notice the cost-performance spread: the Uptone PSU upgrade delivers a 9x noise reduction for 12% of the Torus RM20’s price. Prioritize based on your system’s weakest link—not manufacturer hype. If your DAC measures 112 dBrA SNR, adding a $3,500 power conditioner won’t lift it beyond 117 dBrA—the analog stage ceiling remains unchanged.
Another common misconception is that ‘burn-in’ alters electrical parameters. Accelerated aging tests on 200+ cables (including Nordost Heimdall 2 and Cardas Clear Beyond) conducted at the University of Wisconsin–Madison showed no statistically significant change in capacitance, inductance, or DC resistance after 1,000 hours of continuous 10 V RMS signal exposure. Any perceived ‘break-in’ is neural adaptation—not component evolution.
Finally, consider temporal coherence. The NAD M33 streaming DAC/integrated uses Dirac Live Bass Control and a 32-bit SHARC DSP to time-align drivers across frequency bands. In a review by Hi-Fi News, it reduced group delay variance from ±1.8 ms (passive crossover) to ±0.23 ms (active Dirac correction) between 200 Hz–3.2 kHz—a 7.8x improvement enabling precise instrument localization previously masked by phase smearing.
Don’t chase specs—chase thresholds. Human hearing resolves timing differences down to 10 µs, amplitude changes of 0.5 dB, and frequency shifts of 0.2% at 1 kHz. Every upgrade here targets one or more of those thresholds with documented, repeatable results. That’s not opinion. It’s acoustics.
Isolation platforms aren’t ‘just stands’—they’re mechanical filters. Power conditioners aren’t ‘fancy outlets’—they’re noise gates for your analog stages. Cables aren’t ‘silver wires’—they’re controlled-impedance transmission lines. Treat them as such, measure before and after, and allocate budget where physics guarantees return—not where branding promises magic.
The most expensive upgrade is ignorance. The cheapest is a tape measure and a free copy of Room EQ Wizard. Start there. Verify. Then invest—where the numbers justify it.
Remember: 1 dB of uncorrected room mode dip is audible. 3 µs of interchannel timing error blurs stereo width. 1.2 mV of ground-loop hum masks low-level reverb tails. These aren’t theoretical limits—they’re psychoacoustic baselines established across decades of research. Your system can meet them. Not with hope—but with targeted, measured intervention.
One final note on synergy: the Schiit Yggdrasil DAC measures 121.2 dBrA SNR—but only when fed ultra-low-noise power. Pair it with a noisy wall-wart, and you’ll see 114.8 dBrA in practice. The component doesn’t change—the environment does. That’s why power, isolation, and room treatment appear first in this hierarchy: they define the operating envelope for everything downstream.
Real upgrades don’t shout. They subtract noise. They tighten tolerances. They align phases. They flatten responses. And they do it all in ways you can prove—with tools costing less than many single cables. That’s not luxury. It’s literacy.
If your goal is better sound—not more expensive sound—then stop shopping. Start measuring. Because the best upgrade isn’t something you buy. It’s something you verify.